Perbaikan (Implementasi K-NN Iris Dataset)
Perbaikan (Implementasi K-NN Iris Dataset)#
import matplotlib.pyplot as plt
import numpy as np
import pandas as pd
import seaborn as sns

from sklearn import datasets
from sklearn.model_selection import train_test_split , KFold
from sklearn.preprocessing import Normalizer
from sklearn.metrics import accuracy_score
from sklearn.neighbors import KNeighborsClassifier

from collections import Counter
# import iris dataset
iris = datasets.load_iris()

# np.c_ is the numpy concatenate function
iris_df = pd.DataFrame(data= np.c_[iris['data'], iris['target']],
                      columns= iris['feature_names'] + ['target'])
iris_df.head()
| sepal length (cm) | sepal width (cm) | petal length (cm) | petal width (cm) | target | |
|---|---|---|---|---|---|
| 0 | 5.1 | 3.5 | 1.4 | 0.2 | 0.0 |
| 1 | 4.9 | 3.0 | 1.4 | 0.2 | 0.0 |
| 2 | 4.7 | 3.2 | 1.3 | 0.2 | 0.0 |
| 3 | 4.6 | 3.1 | 1.5 | 0.2 | 0.0 |
| 4 | 5.0 | 3.6 | 1.4 | 0.2 | 0.0 |
iris_df.describe()
| sepal length (cm) | sepal width (cm) | petal length (cm) | petal width (cm) | target | |
|---|---|---|---|---|---|
| count | 150.000000 | 150.000000 | 150.000000 | 150.000000 | 150.000000 |
| mean | 5.843333 | 3.057333 | 3.758000 | 1.199333 | 1.000000 |
| std | 0.828066 | 0.435866 | 1.765298 | 0.762238 | 0.819232 |
| min | 4.300000 | 2.000000 | 1.000000 | 0.100000 | 0.000000 |
| 25% | 5.100000 | 2.800000 | 1.600000 | 0.300000 | 0.000000 |
| 50% | 5.800000 | 3.000000 | 4.350000 | 1.300000 | 1.000000 |
| 75% | 6.400000 | 3.300000 | 5.100000 | 1.800000 | 2.000000 |
| max | 7.900000 | 4.400000 | 6.900000 | 2.500000 | 2.000000 |
# Split into X and Y

x= iris_df.iloc[:, :-1]
y= iris_df.iloc[:, -1]
x.head()
| sepal length (cm) | sepal width (cm) | petal length (cm) | petal width (cm) | |
|---|---|---|---|---|
| 0 | 5.1 | 3.5 | 1.4 | 0.2 |
| 1 | 4.9 | 3.0 | 1.4 | 0.2 |
| 2 | 4.7 | 3.2 | 1.3 | 0.2 |
| 3 | 4.6 | 3.1 | 1.5 | 0.2 |
| 4 | 5.0 | 3.6 | 1.4 | 0.2 |
y.head()
0    0.0
1    0.0
2    0.0
3    0.0
4    0.0
Name: target, dtype: float64
# split the data into train and test sets
x_train, x_test, y_train, y_test= train_test_split(x, y,
                                                   test_size= 0.2,
                                                   shuffle= True, #shuffle the data to avoid bias
                                                   random_state= 0)
x_train= np.asarray(x_train)
y_train= np.asarray(y_train)

x_test= np.asarray(x_test)
y_test= np.asarray(y_test)
print(f'training set size: {x_train.shape[0]} samples \ntest set size: {x_test.shape[0]} samples')
training set size: 120 samples
test set size: 30 samples
#Normalize the Dataset

scaler= Normalizer().fit(x_train) # the scaler is fitted to the training set
normalized_x_train= scaler.transform(x_train) # the scaler is applied to the training set
normalized_x_test= scaler.transform(x_test) # the scaler is applied to the test set
print('x train before Normalization')
print(x_train[0:5])
print('\nx train after Normalization')
print(normalized_x_train[0:5])
x train before Normalization
[[6.4 3.1 5.5 1.8]
 [5.4 3.  4.5 1.5]
 [5.2 3.5 1.5 0.2]
 [6.1 3.  4.9 1.8]
 [6.4 2.8 5.6 2.2]]

x train after Normalization
[[0.69804799 0.338117   0.59988499 0.196326  ]
 [0.69333409 0.38518561 0.57777841 0.1925928 ]
 [0.80641965 0.54278246 0.23262105 0.03101614]
 [0.71171214 0.35002236 0.57170319 0.21001342]
 [0.69417747 0.30370264 0.60740528 0.2386235 ]]
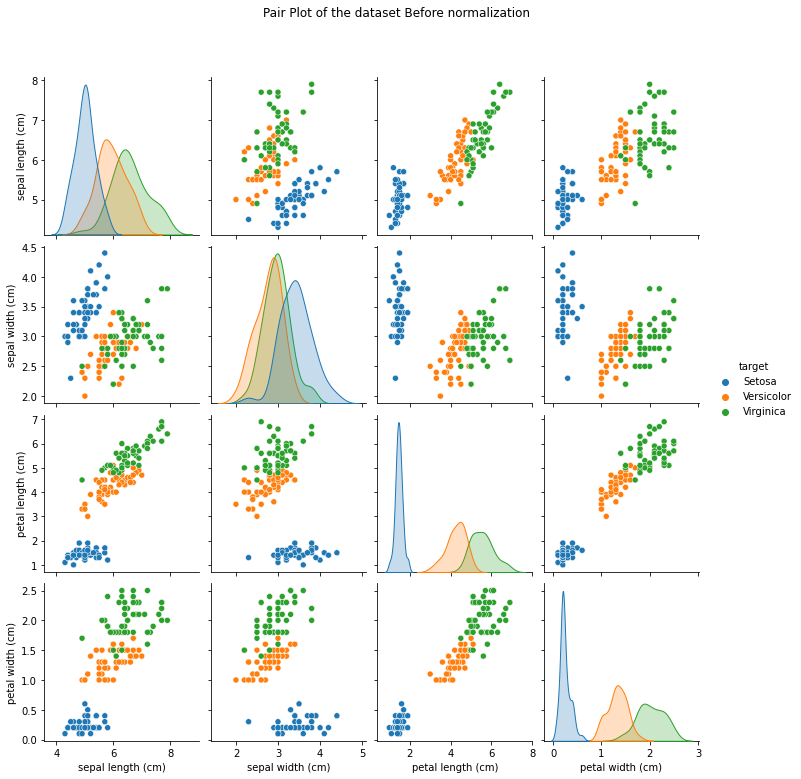
#Visualize the Dataset before and after Normalization
## Before
# View the relationships between variables; color code by species type
di= {0.0: 'Setosa', 1.0: 'Versicolor', 2.0:'Virginica'} # dictionary
before= sns.pairplot(iris_df.replace({'target': di}), hue= 'target')
before.fig.suptitle('Pair Plot of the dataset Before normalization', y=1.08)
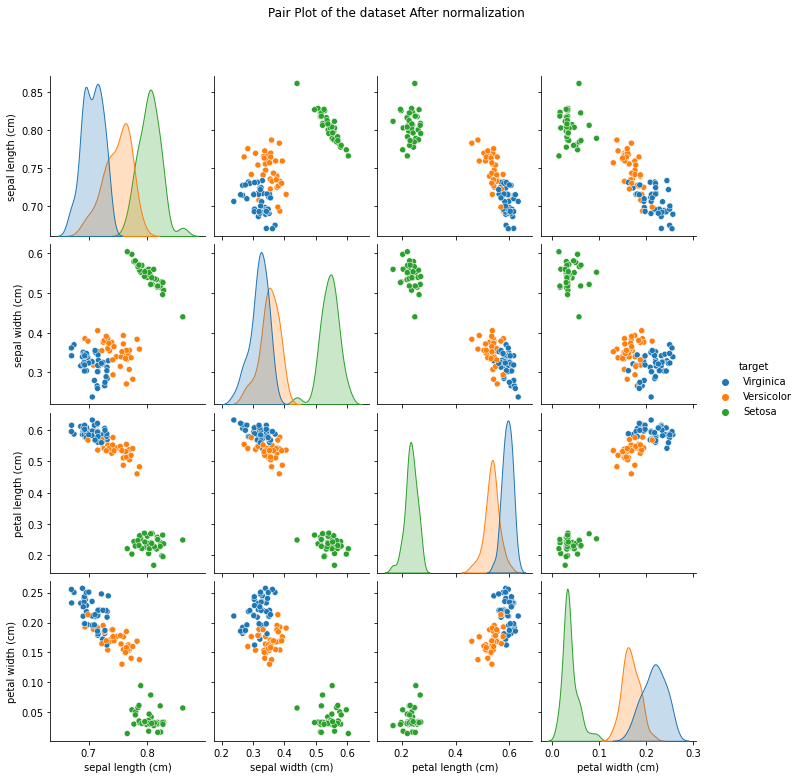
## After
iris_df_2= pd.DataFrame(data= np.c_[normalized_x_train, y_train],
columns= iris['feature_names'] + ['target'])
di= {0.0: 'Setosa', 1.0: 'Versicolor', 2.0: 'Virginica'}
after= sns.pairplot(iris_df_2.replace({'target':di}), hue= 'target')
after.fig.suptitle('Pair Plot of the dataset After normalization', y=1.08)
Text(0.5, 1.08, 'Pair Plot of the dataset After normalization')
#KNN Step 1 (Euclidean Distance)

def distance_ecu(x_train, x_test_point):
  """
  Input:
    - x_train: corresponding to the training data
    - x_test_point: corresponding to the test point

  Output:
    -distances: The distances between the test point and each point in the training data.

  """
  distances= []  ## create empty list called distances
  for row in range(len(x_train)): ## Loop over the rows of x_train
      current_train_point= x_train[row] #Get them point by point
      current_distance= 0 ## initialize the distance by zero

      for col in range(len(current_train_point)): ## Loop over the columns of the row

          current_distance += (current_train_point[col] - x_test_point[col]) **2
          ## Or current_distance = current_distance + (x_train[i] - x_test_point[i])**2
      current_distance= np.sqrt(current_distance)

      distances.append(current_distance) ## Append the distances

  # Store distances in a dataframe
  distances= pd.DataFrame(data=distances,columns=['dist'])
  return distances
#KNN Step 2 (Find the nearest neighbors)

def nearest_neighbors(distance_point, K):
    """
    Input:
        -distance_point: the distances between the test point and each point in the training data.
        -K             : the number of neighbors

    Output:
        -df_nearest: the nearest K neighbors between the test point and the training data.

    """

    # Sort values using the sort_values function
    df_nearest= distance_point.sort_values(by=['dist'], axis=0)

    ## Take only the first K neighbors
    df_nearest= df_nearest[:K]
    return df_nearest
#KNN Step 3 (Classify the point based on a majority vote)

def voting(df_nearest, y_train):
    """
    Input:
        -df_nearest: dataframe contains the nearest K neighbors between the full training dataset and the test point.
        -y_train: the labels of the training dataset.

    Output:
        -y_pred: the prediction based on Majority Voting

    """

    ## Use the Counter Object to get the labels with K nearest neighbors.
    counter_vote= Counter(y_train[df_nearest.index])

    y_pred= counter_vote.most_common()[0][0]   # Majority Voting

    return y_pred
#KNN Full Algorithm: Putting Everything Together

def KNN_from_scratch(x_train, y_train, x_test, K):

    """
    Input:
    -x_train: the full training dataset
    -y_train: the labels of the training dataset
    -x_test: the full test dataset
    -K: the number of neighbors

    Output:
    -y_pred: the prediction for the whole test set based on Majority Voting.

    """

    y_pred=[]

    ## Loop over all the test set and perform the three steps
    for x_test_point in x_test:
      distance_point  = distance_ecu(x_train, x_test_point)  ## Step 1
      df_nearest_point= nearest_neighbors(distance_point, K)  ## Step 2
      y_pred_point    = voting(df_nearest_point, y_train) ## Step 3
      y_pred.append(y_pred_point)

    return y_pred
#Test the KNN Algorithm on the test dataset

K=3
y_pred_scratch= KNN_from_scratch(normalized_x_train, y_train, normalized_x_test, K)
print(y_pred_scratch)
[2.0, 1.0, 0.0, 2.0, 0.0, 2.0, 0.0, 1.0, 1.0, 1.0, 2.0, 1.0, 1.0, 1.0, 1.0, 0.0, 1.0, 2.0, 0.0, 0.0, 2.0, 1.0, 0.0, 0.0, 2.0, 0.0, 0.0, 1.0, 1.0, 0.0]
#Compare our implementation with Sklearn library

knn=KNeighborsClassifier(K)
knn.fit(normalized_x_train, y_train)
y_pred_sklearn= knn.predict(normalized_x_test)
print(y_pred_sklearn)
[2. 1. 0. 2. 0. 2. 0. 1. 1. 1. 2. 1. 1. 1. 1. 0. 1. 2. 0. 0. 2. 1. 0. 0.
 2. 0. 0. 1. 1. 0.]
#Check if the output is exactly the same

print(np.array_equal(y_pred_sklearn, y_pred_scratch))
True
#Calculate the accuracy of both methods

print(f'The accuracy of our implementation is {accuracy_score(y_test, y_pred_scratch)}')
print(f'The accuracy of sklearn implementation is {accuracy_score(y_test, y_pred_sklearn)}')
The accuracy of our implementation is 0.9666666666666667
The accuracy of sklearn implementation is 0.9666666666666667
#Perform Hyper-parameter Tuning using K-fold Cross Validation

n_splits= 4 ## Choose the number of splits
kf= KFold(n_splits= n_splits) ## Call the K Fold function

accuracy_k= [] ## Keep track of the accuracy for each K
k_values= list(range(1,30,2)) ## Search for the best value of K

for k in k_values: ## Loop over the K values
  accuracy_fold= 0
  for normalized_x_train_fold_idx, normalized_x_valid_fold_idx in  kf.split(normalized_x_train): ## Loop over the splits
      normalized_x_train_fold= normalized_x_train[normalized_x_train_fold_idx] ## fetch the values
      y_train_fold= y_train[normalized_x_train_fold_idx]

      normalized_x_test_fold= normalized_x_train[normalized_x_valid_fold_idx]
      y_valid_fold= y_train[normalized_x_valid_fold_idx]
      y_pred_fold= KNN_from_scratch(normalized_x_train_fold, y_train_fold, normalized_x_test_fold, k)

      accuracy_fold+= accuracy_score (y_pred_fold, y_valid_fold) ## Accumulate the accuracy
  accuracy_fold= accuracy_fold/ n_splits ## Divide by the number of splits
  accuracy_k.append(accuracy_fold)
print(f'The accuracy for each K value was {list ( zip (accuracy_k, k_values))}') ## creates a tuple with accuracy corresponding to k value
The accuracy for each K value was [(0.9666666666666668, 1), (0.9666666666666668, 3), (0.9666666666666668, 5), (0.9666666666666668, 7), (0.9583333333333333, 9), (0.9583333333333333, 11), (0.9583333333333334, 13), (0.95, 15), (0.9583333333333333, 17), (0.9583333333333333, 19), (0.9583333333333333, 21), (0.9583333333333333, 23), (0.9583333333333333, 25), (0.9583333333333333, 27), (0.9583333333333333, 29)]
print(f'Best accuracy was {np.max(accuracy_k)}, which corresponds to a value of K= {k_values[np.argmax(accuracy_k)]}')
Best accuracy was 0.9666666666666668, which corresponds to a value of K= 1